How to read your audiogram
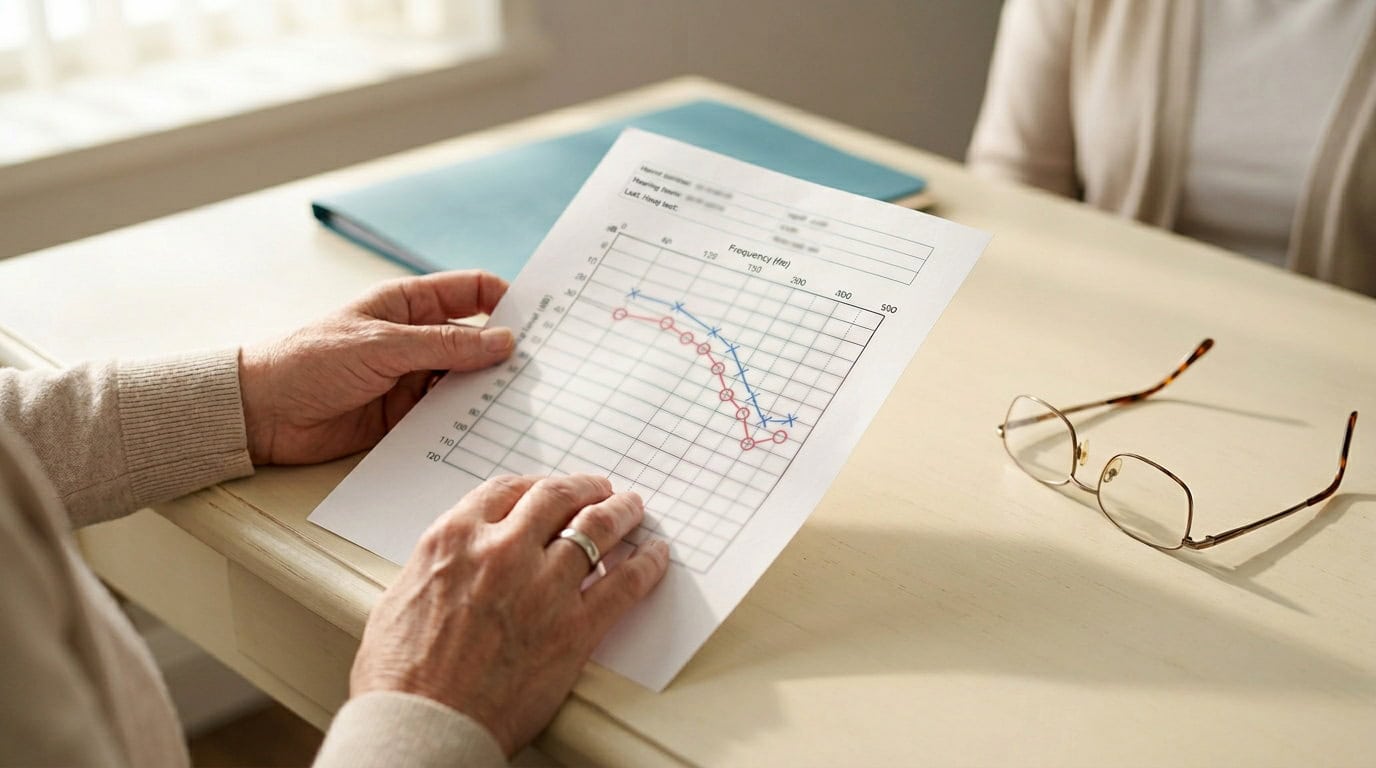
Your audiologist / Audiometrist just handed you a chart. There’s a graph, some X’s and O’s, numbers on both axes, and possibly a line that curves in ways you don’t quite understand.
This is your audiogram. It’s the most important document that comes out of your hearing assessment, and it tells a complete story about how your hearing works. Here’s how to read it.
Had a comprehensive hearing assessment at Precision Hearing? Your audiologist / audiometrist will walk you through your audiogram before you leave. This guide is here so you can revisit it at home.
What is an audiogram?
An audiogram is a visual map of your hearing thresholds: the softest sounds you can hear across a range of frequencies. Think of it as a hearing fingerprint. No 2 look exactly the same.
It’s produced during pure tone audiometry, one of the 6 components of a comprehensive hearing assessment. You wear headphones and respond to a series of tones, each at a different pitch and volume. The audiologist/audiometrist records the softest tone you can detect at each frequency, for each ear separately.
Understanding the axes
The horizontal axis: frequency (pitch)
The horizontal axis runs from low frequencies (250 Hz, on the left) to high frequencies (8000 Hz, on the right). This covers most of the speech range.
Low frequencies carry the power of speech sounds like vowels. High frequencies carry the clarity, things like consonants: S, F, TH, SH, CH. This is why people with high-frequency hearing loss often hear that someone is talking, but can’t make out what they’re saying.
The vertical axis: volume (loudness)
The vertical axis measures how loud a sound needs to be before you can hear it, in decibels (dB HL). Crucially, the scale runs top to bottom: 0 dB at the top represents excellent hearing, and the numbers increase as you move down.
A threshold at 10-20 dB means you can hear very quiet sounds. A threshold at 60 dB means you need sounds to be quite loud before you detect them.
What the symbols mean
Each ear is plotted separately:
- O (circle) = right ear responses (tested by air conduction headphones)
- X (cross) = left ear responses (tested by air conduction headphones)
- = right ear bone conduction (a vibrating probe placed behind the ear)
- < = left ear bone conduction
Bone conduction testing tells your audiologist whether hearing loss is coming from the middle ear (something physical, like fluid or a perforated eardrum) or from the inner ear (sensorineural hearing loss, which is the most common type).
The degrees of hearing loss
Where your thresholds sit on the chart determines the degree of hearing loss:
| Threshold range | Classification |
|---|---|
| 0-25 dB HL | Normal hearing |
| 26-40 dB HL | Mild hearing loss |
| 41-55 dB HL | Moderate hearing loss |
| 56-70 dB HL | Moderately severe hearing loss |
| 71-90 dB HL | Severe hearing loss |
| 91+ dB HL | Profound hearing loss |
Most people with mild to moderate hearing loss don’t realise it because the change is gradual. The audiogram shows it clearly.
The shape of the audiogram matters as much as the degree
Two people can have the same average hearing loss but very different experiences. The shape of the audiogram reveals which sounds are affected most.
Flat loss
Thresholds are similar across all frequencies. Usually caused by sensorineural or middle ear issues affecting the whole range evenly.
High-frequency sloping loss
The most common pattern. Hearing is normal in the low frequencies but drops off sharply in the highs. Classic age-related or noise-induced hearing loss. People with this pattern often struggle most in noisy environments and with consonants.
Cookie-bite (mid-frequency) loss
Thresholds dip in the mid-range frequencies but are relatively preserved at the low and high ends. Usually genetic in origin.
Low-frequency loss
Less common. Often associated with Meniere’s disease or sudden sensorineural hearing loss.
What happens after your audiogram?
The audiogram is one input into a full clinical picture. Your audiologist / audiometrist also considers your speech test results, tympanometry findings, case history, and the listening situations where you struggle most.
Together, these determine whether hearing aids are appropriate, which type and technology level would suit your pattern of loss, whether further medical investigation is warranted, and whether other solutions like cochlear implants or assistive devices are worth exploring.
If hearing aids aren’t needed, your audiologist/audiometrist will tell you that and explain what to watch for over time. An audiogram is also a useful baseline: tracking how your hearing changes year on year is valuable, even when intervention isn’t yet needed.
Why Your Audiogram Matters Beyond Hearing
Recent research shows untreated hearing loss is linked to cognitive decline, depression, and reduced quality of life. Getting a baseline audiogram, even if you don’t need intervention yet, is an investment in your long-term health, not just your hearing today.
At Precision Hearing, We Prioritise Your Health Over Sales
We assess whether hearing aids genuinely benefit your specific hearing loss. We never recommend devices you don’t need. Our recommendation is based entirely on your audiogram results and listening needs, not sales targets.
If your hearing loss doesn’t warrant hearing aids, we’ll tell you honestly and explain what to watch for over time. If a different solution, like a cochlear implant, assistive devices, or a combination approach, is more appropriate for your situation, we’ll recommend that instead.
Your best outcome is always our priority.
Questions about your audiogram results?
Your audiologist at Precision Hearing will explain exactly what your results mean in plain language, including what they mean for your day-to-day life and what your options are.
Book a Comprehensive Hearing Assessment
Ready to Take the Next Step?
Talk to an Audiologist Who’ll Give You a Straight Answer
We’ve been helping Sydney families hear better since 1999. Book a consultation at one of our 4 locations and we’ll give you an honest assessment of your options, no pressure, no obligation.